Debug JavaScript code
with Chrome Developer Tools (Version 121.0.6167.185)
With the help of a debugger it is possible to pause a program at a certain point. To begin with, it is easiest to use the Chrome Developer Tools for this. However, other browsers also have similar tools for debugging, which all work in a similar way. The various development environments also have such tools for debugging. Debuggers make it easy to understand the flow of a program.
Example code to debug
Complete Code - Examples/Part_109/script.js...
 function findDuplicates() {
   const numbers = [2, 4, 5, 2, 5, 8, 5, 8611];
   for(let i = 0; i < numbers.length; i++) {
     const numberI = numbers[i];
     for(let j = 0; j < numbers.length; j++) {
       const numberJ = numbers[j];
       if(numberI === numberJ) {
         console.log(`Duplicate number found: ${numberI}`);
       }
     }
   }
 }
 document.addEventListener('DOMContentLoaded', findDuplicates);
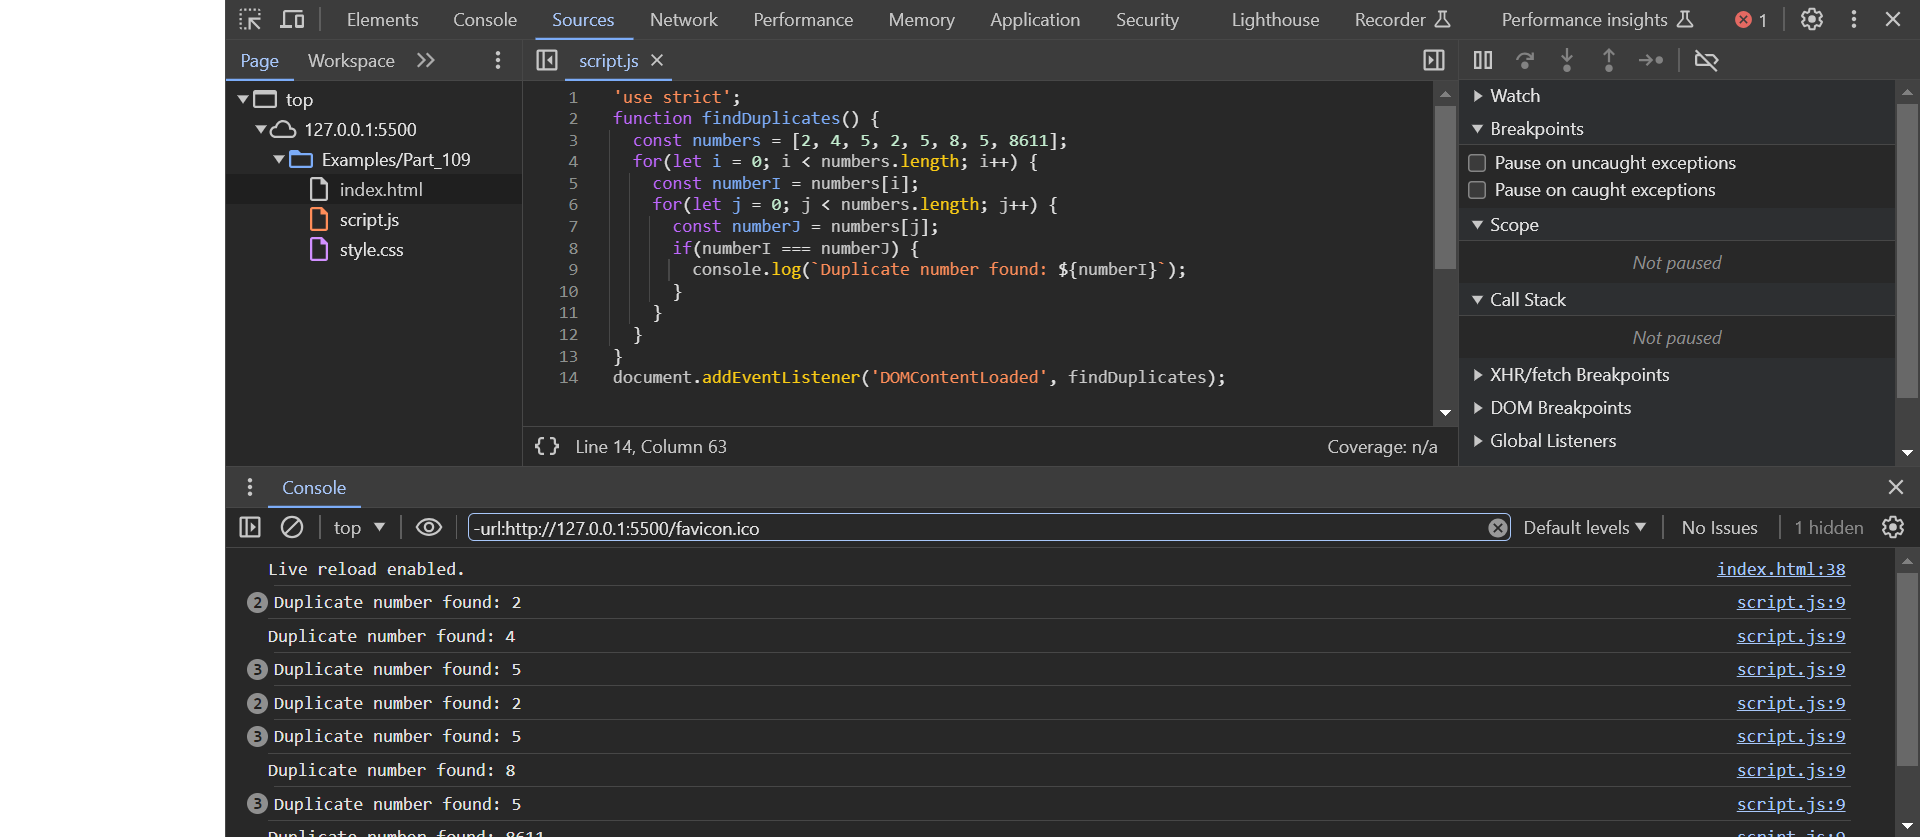
In the example function findDuplicates(), all entries of the array numbers that occur twice are to be output. However, the function contains an error, which means that every entry is recognized as duplicate.
Complete Code - Examples/Part_109/index.html...
 <!DOCTYPE html>
 <html>
 <head lang="en">
   <meta charset="UTF-8">
   <title>Example of debugging</title>
   <link rel="stylesheet" href="style.css" type="text/css">
 </head>
 <body>
 <script src="script.js"></script>
 </body>
 </html>
1. Define breakpoints
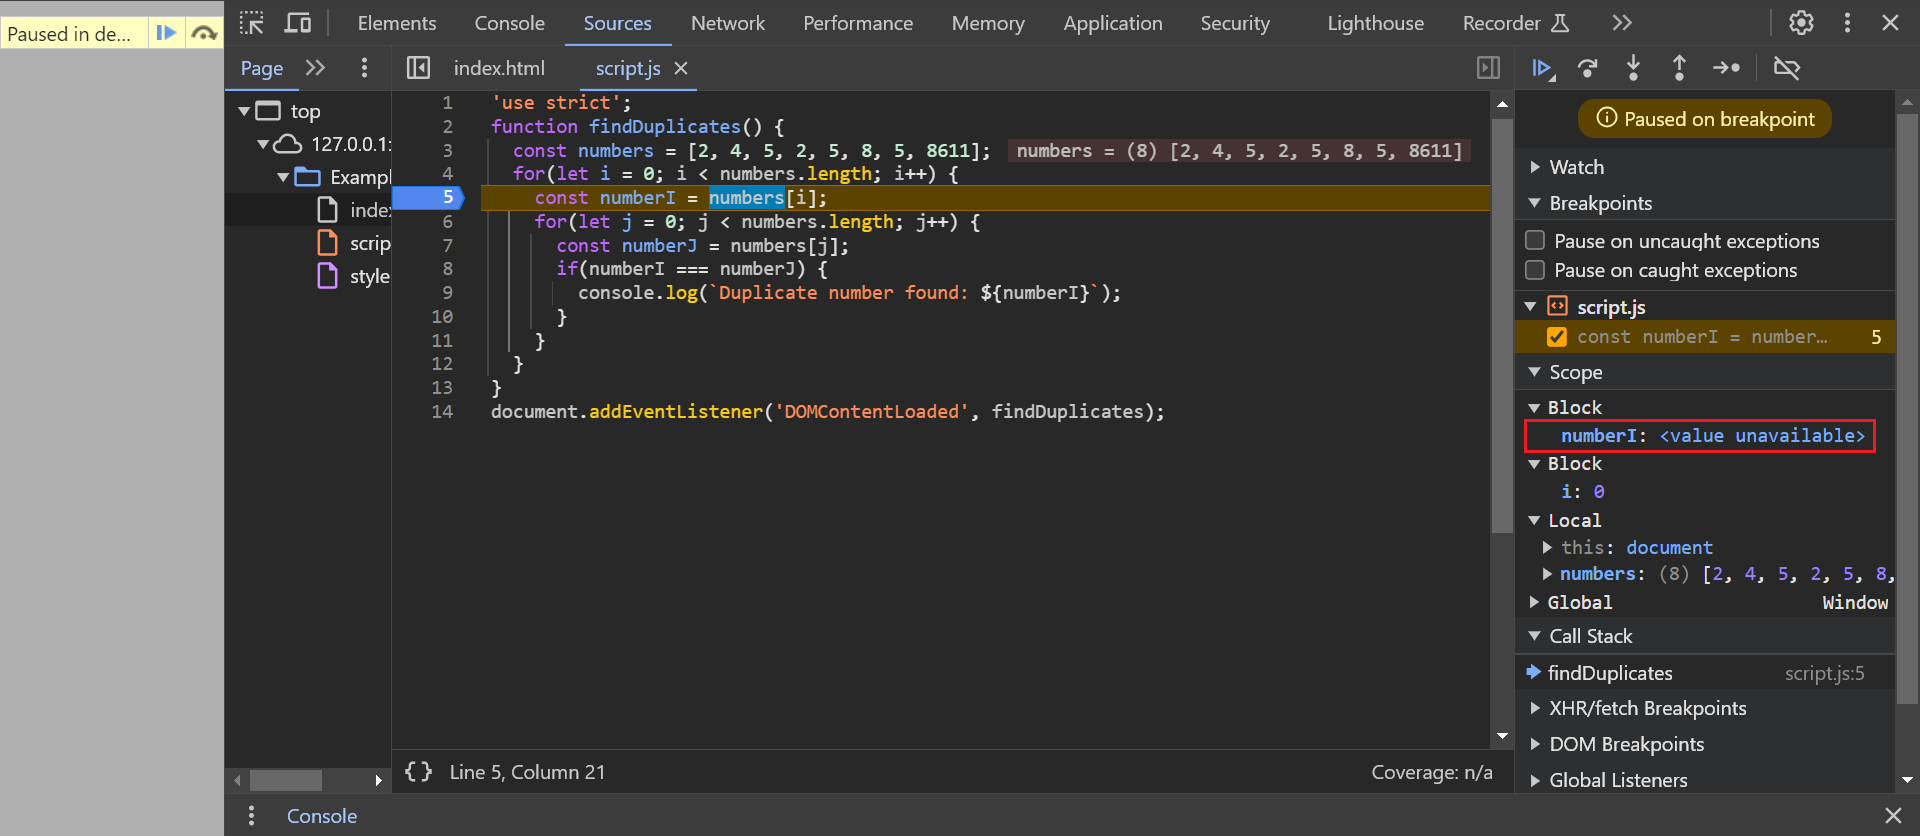
As soon as the browser (Chrome) opens the file, simply right-click on the empty page, then select Inspect --> and then go to the Sources tab. The file is displayed on the left-hand side, i.e. the JavaScript file and the HTML file. As soon as script.js is clicked, the code is displayed in the built-in code editor (middle column).
This view can now be used to define breakpoints at which the execution of the respective program is to be stopped. Breakpoints allow the developer to "jump into" a program at a certain point in time and execute the following instructions step by step from the corresponding breakpoint.
To define a breakpoint, simply click to the left of the corresponding line in the source text (line number). The blue marking indicates that a breakpoint has been defined for the corresponding line.
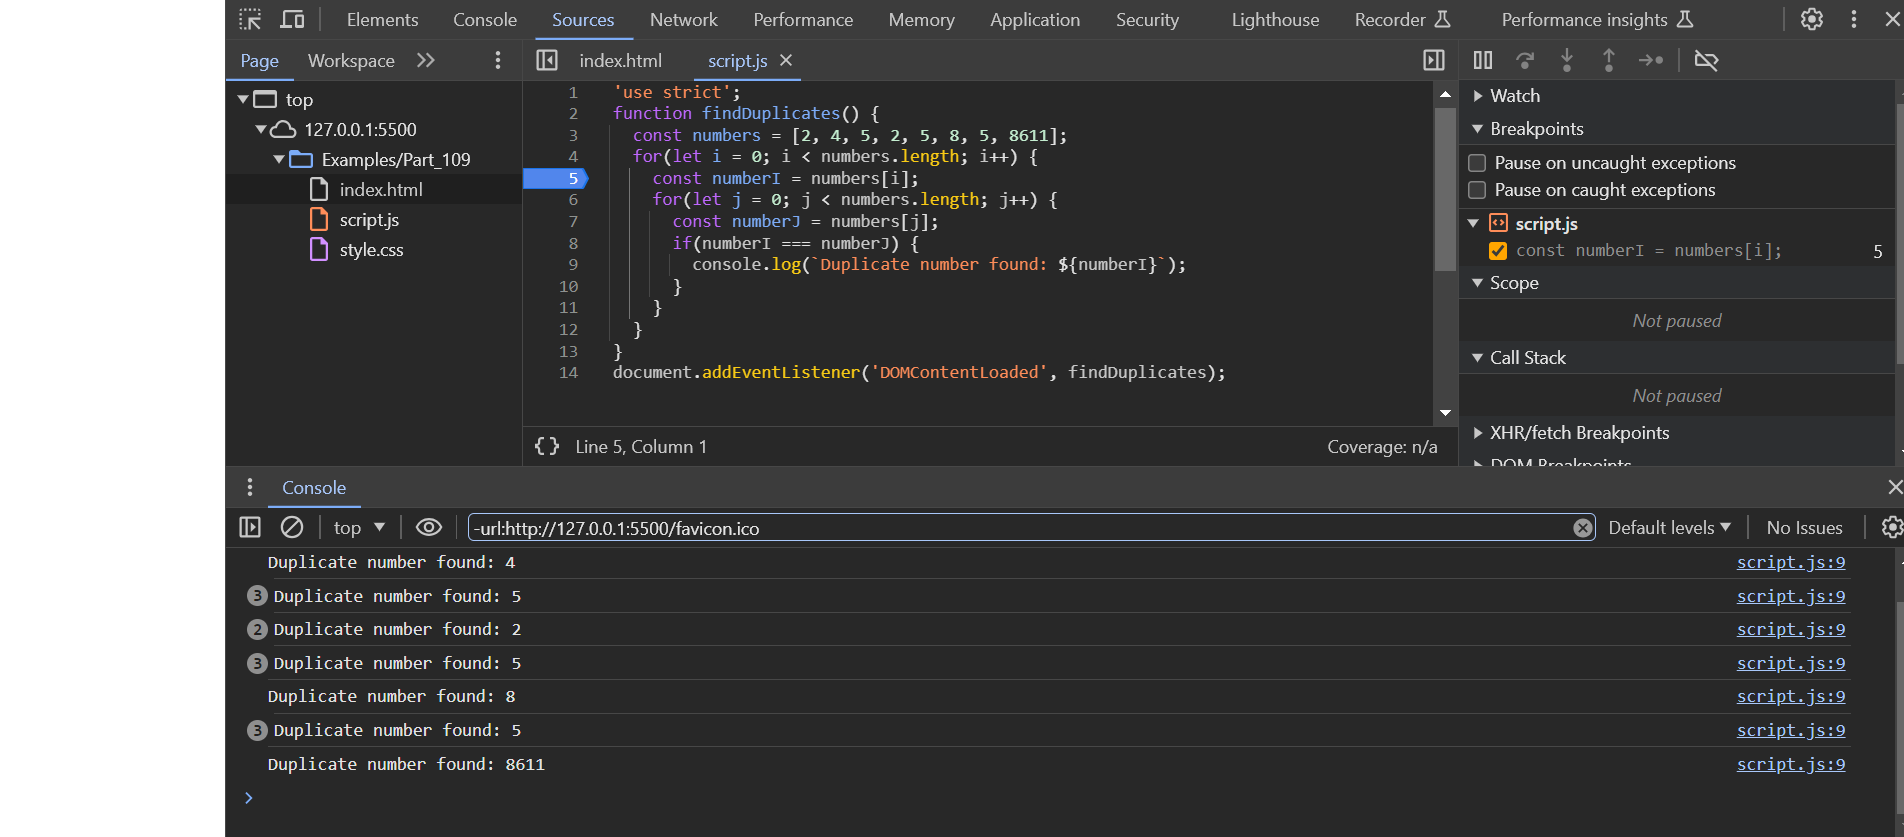
When the HTML file is reloaded in the browser (F5), the program stops at exactly the defined breakpoint.
Define breakpoints using the keyword debugger
The keyword debugger can be used to define a breakpoint directly in the code, as the keyword debugger is part of the language and therefore independent of the debugging tool:
 function findDuplicates() {
   const numbers = [2, 4, 5, 2, 5, 8, 5, 8611];
   for(let i = 0; i < numbers.length; i++) {
     const numberI = numbers[i];
     debugger;                                  // breakpoint
     for(let j = 0; j < numbers.length; j++) {
       const numberJ = numbers[j];
       if(numberI === numberJ) {
         console.log(`Duplicate number found: ${numberI}`);
       }
     }
   }
 }
 document.addEventListener('DOMContentLoaded', findDuplicates);
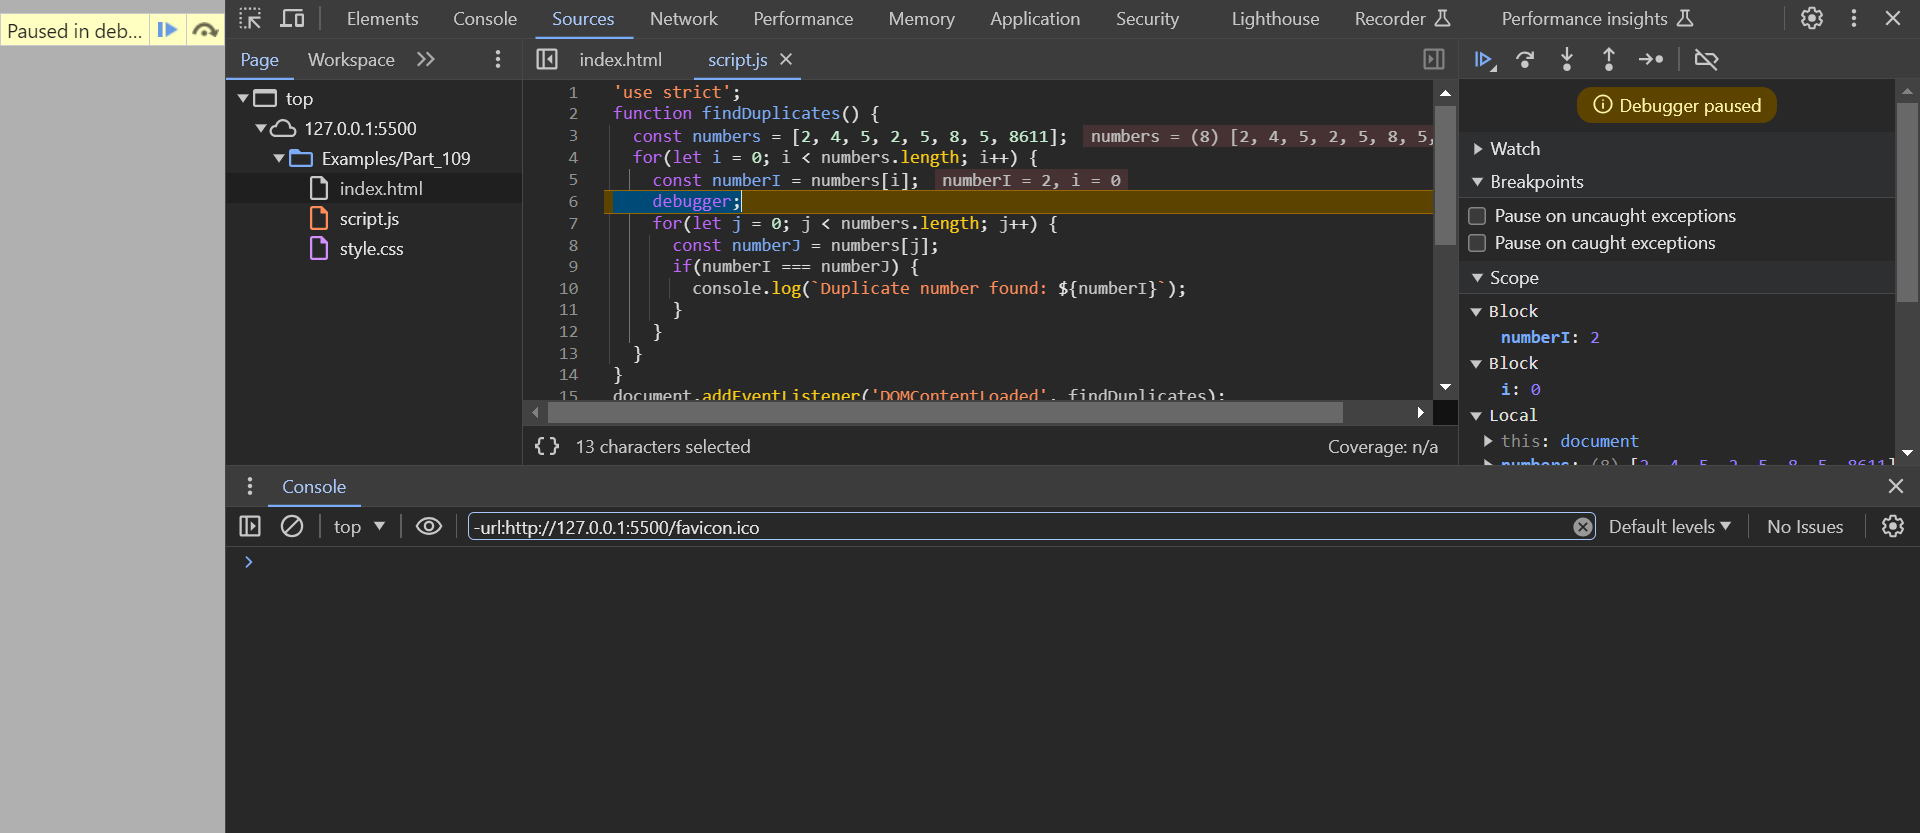
When the file is then opened in the browser, the breakpoint is directly visible.
2. View variable assignments
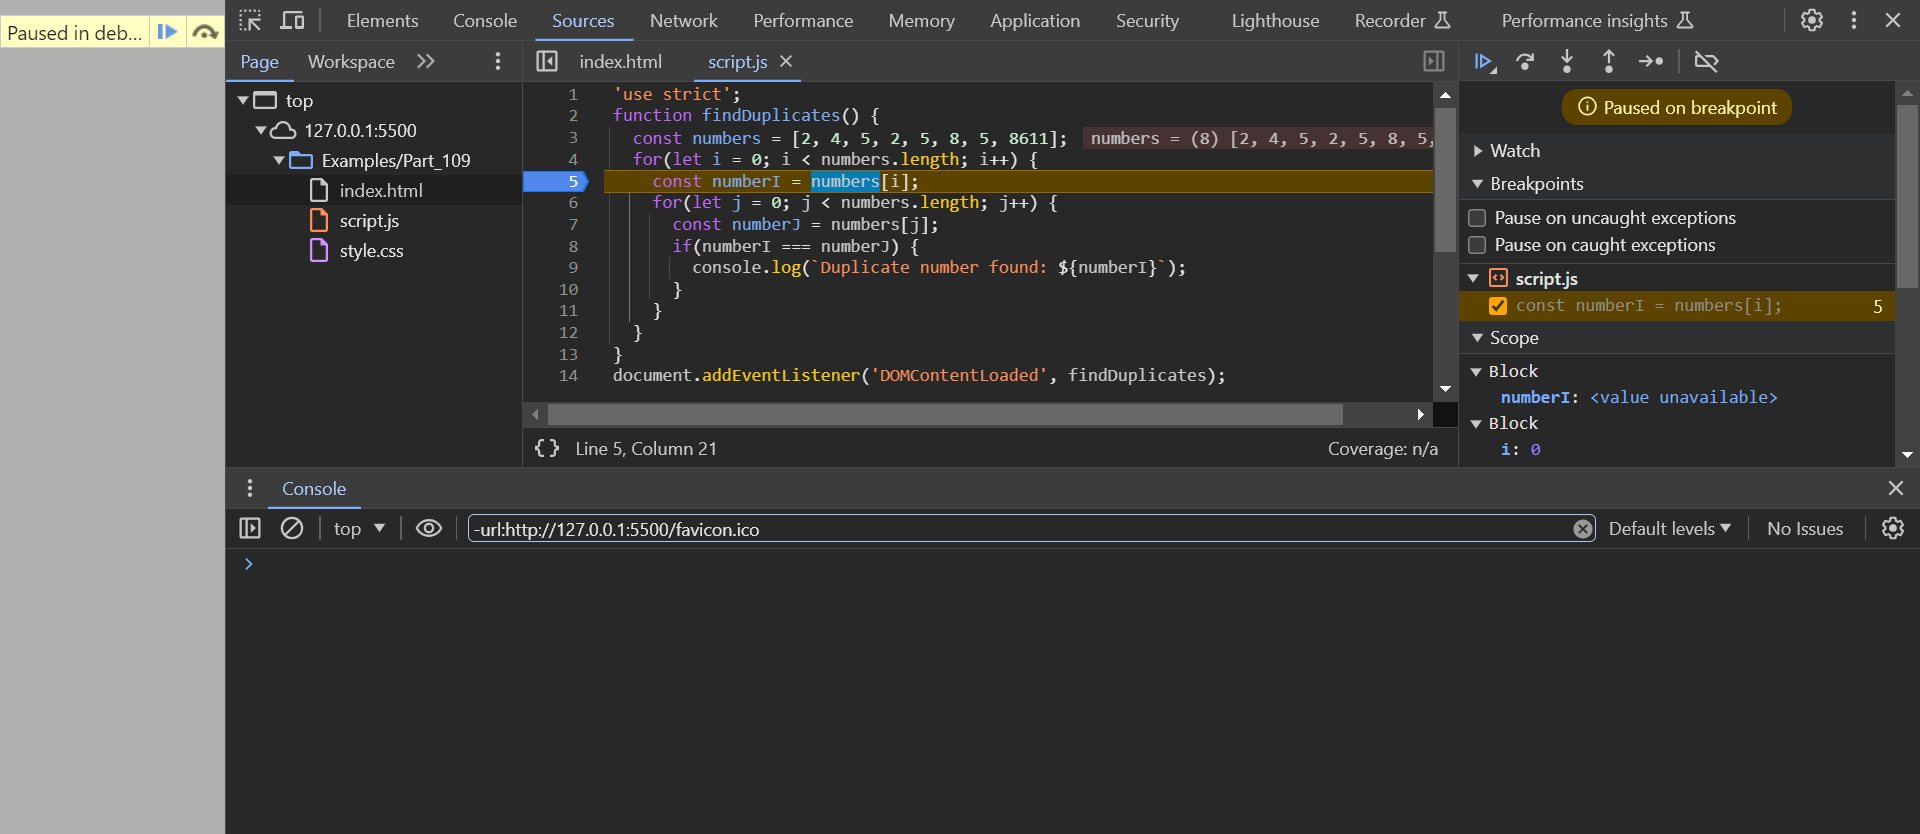
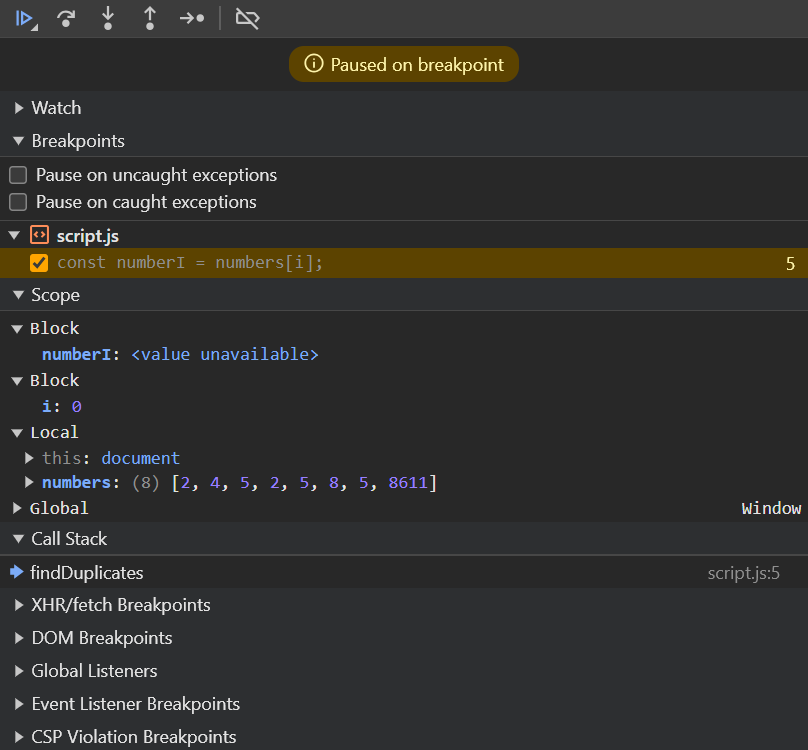
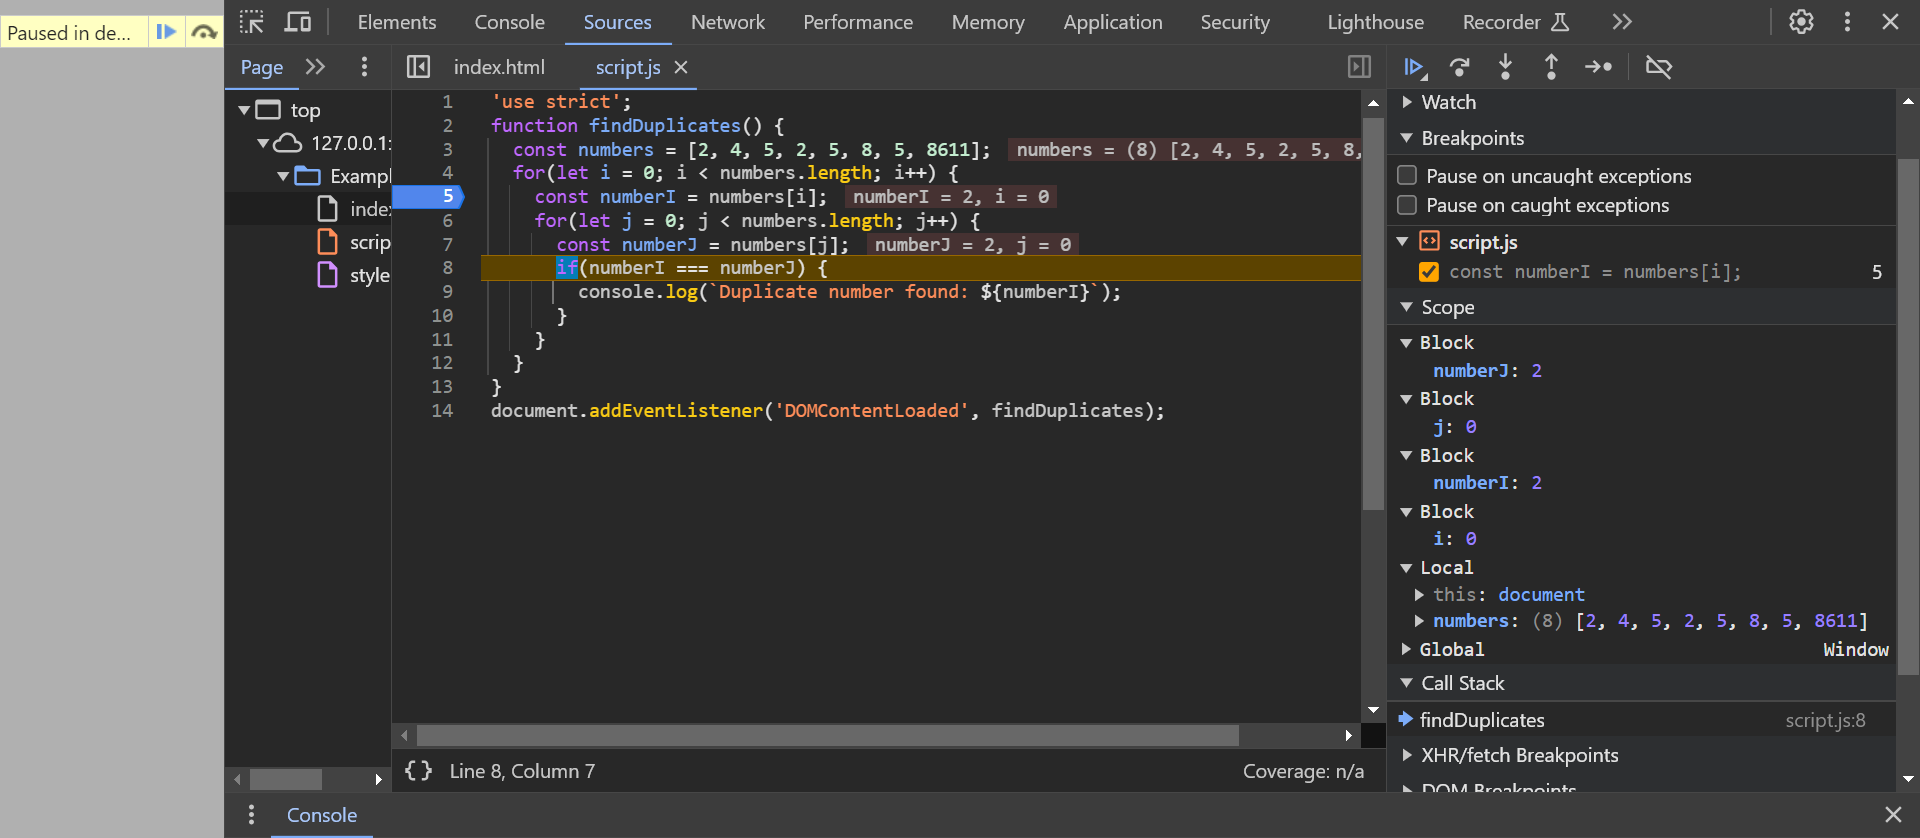
Once the program has been stopped, you now have the option of viewing the respective variable assignments, i.e. the current values of the visible variables. These can be found in the Sources view on the right-hand side under the Scope tab. In the example, you can see that the variable numberI still has the value undefined (as it has not yet been executed because it is stopped) and the variable i has the value 0.
3. Running a program step-by-step
Using the navigation, you also have the option of executing the source code manually step by step.
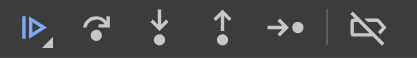
 |
Continue: Continue execution of the program |
 |
Execute: execute the next instruction |
 |
Jump in: jump into the next function call |
 |
Jump out: jump out of the current function call |
 |
Next: jump to next line |
 |
Deactivate/activate breakpoints |
Until now, the HTML file was loaded in the browser, the breakpoint was defined and then Chrome (F5) was reloaded:
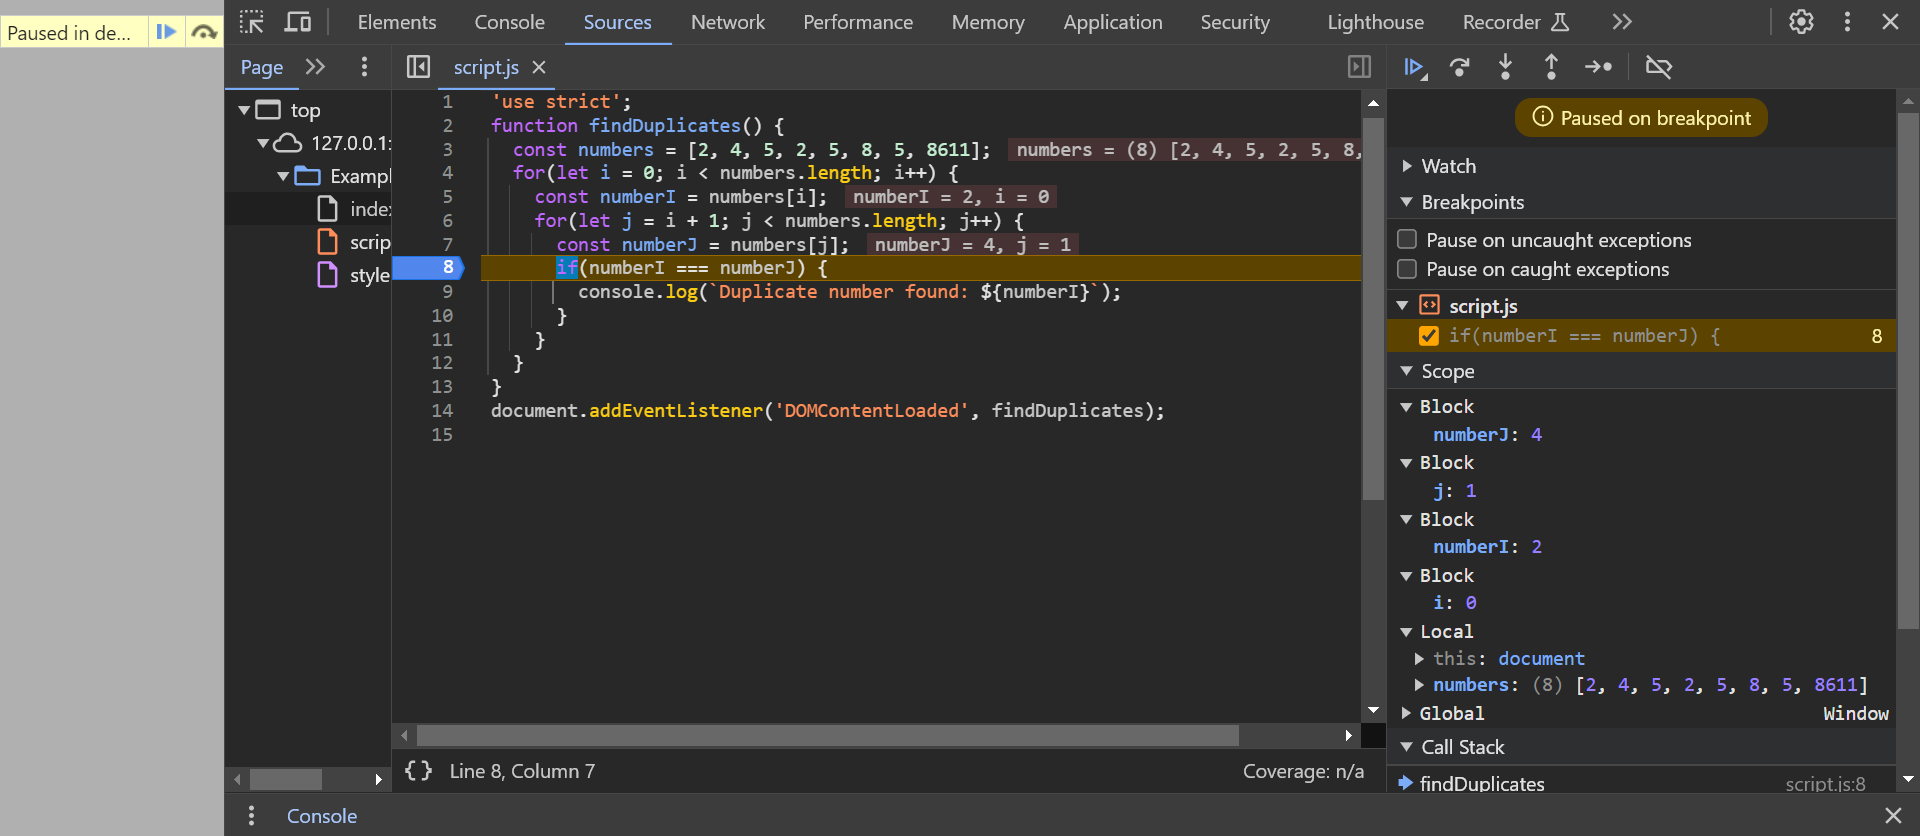
If the button (execute) is now pressed from the defined breakpoint to execute the next instruction, the instruction const numberI = numbers[i] is executed, giving the variable numberI the value 2.
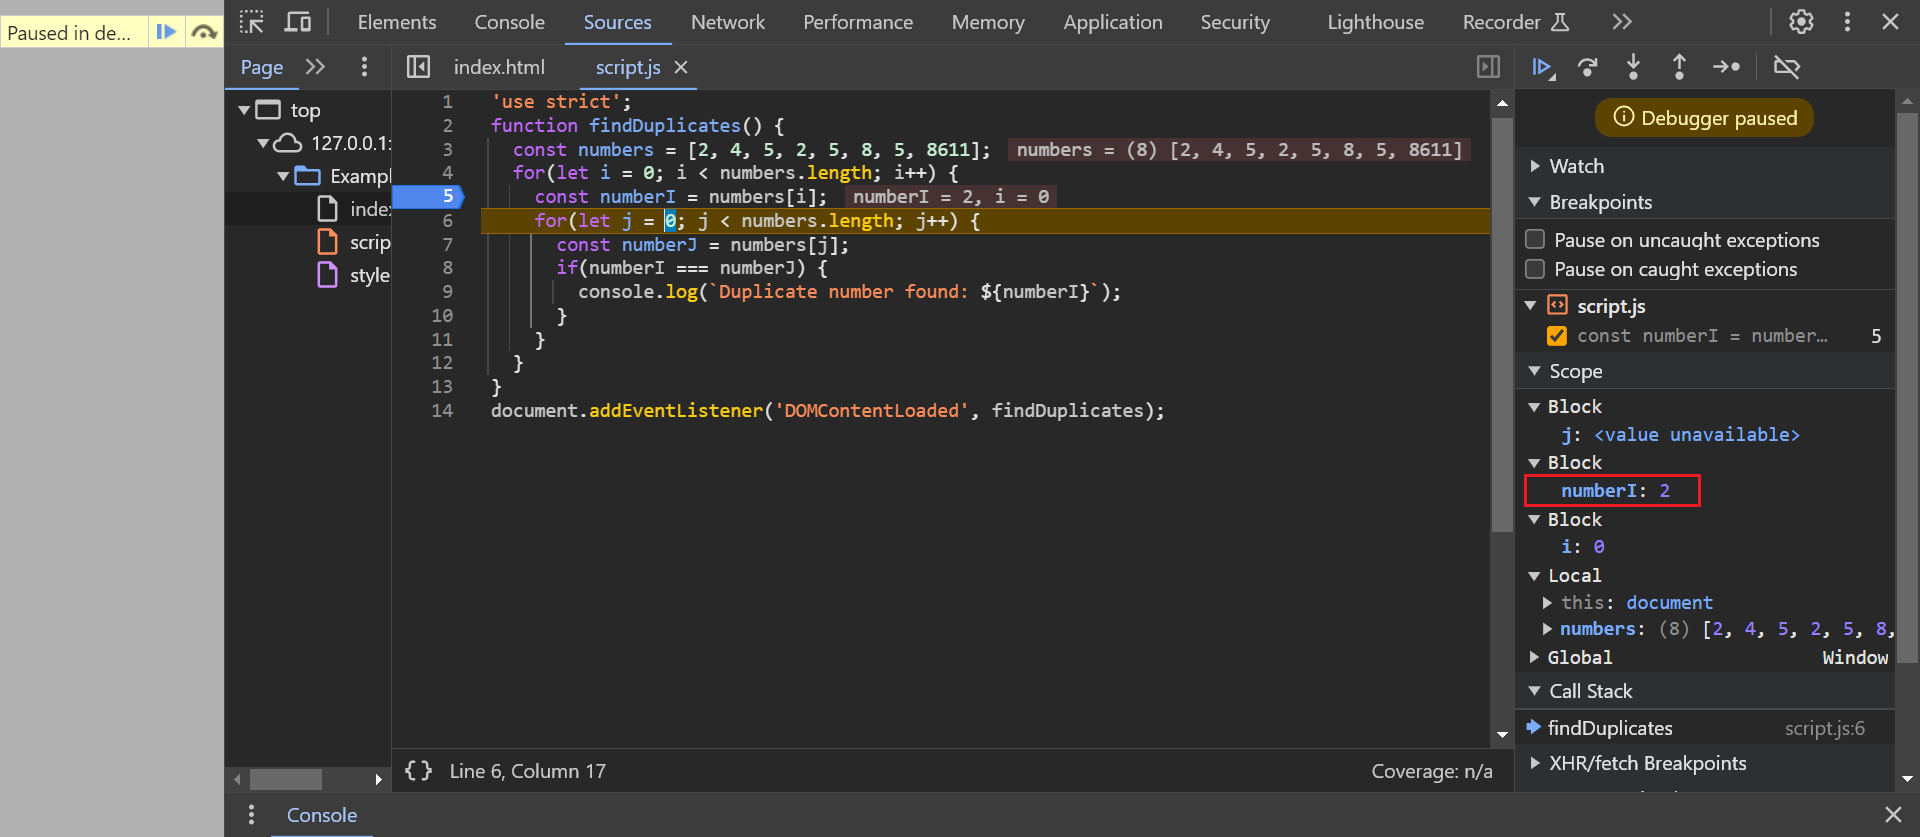
If the instructions up to line 7 are now executed, you can also see directly where the error is in the code. The inner counting loop compares each element of the array (in the variable numberJ), whereby each element, i.e. each number, is compared with itself.
To fix the bug, it is sufficient to let the inner counting loop count from the position i + 1. This means that the current element is compared with all subsequent elements:
Complete Code - Examples/Part_110/script.js...
 function findDuplicates() {
   const numbers = [2, 4, 5, 2, 5, 8, 5, 8611];
   for(let i = 0; i < numbers.length; i++) {
     const numberI = numbers[i];
     for(let j = i + 1; j < numbers.length; j++) {      // let j = i + 1; instead of let j = 0;
       const numberJ = numbers[j];
       if(numberI === numberJ) {
         console.log(`Duplicate number found: ${numberI}`);
       }
     }
   }
 }
 document.addEventListener('DOMContentLoaded', findDuplicates);
This not only prevents each number from being compared with itself, but also prevents two elements from being compared with each other twice.
4. Define multiple breakpoints
Several breakpoints can also be defined within a program. The continue button can then be used to "jump" to the next breakpoint in the program flow.
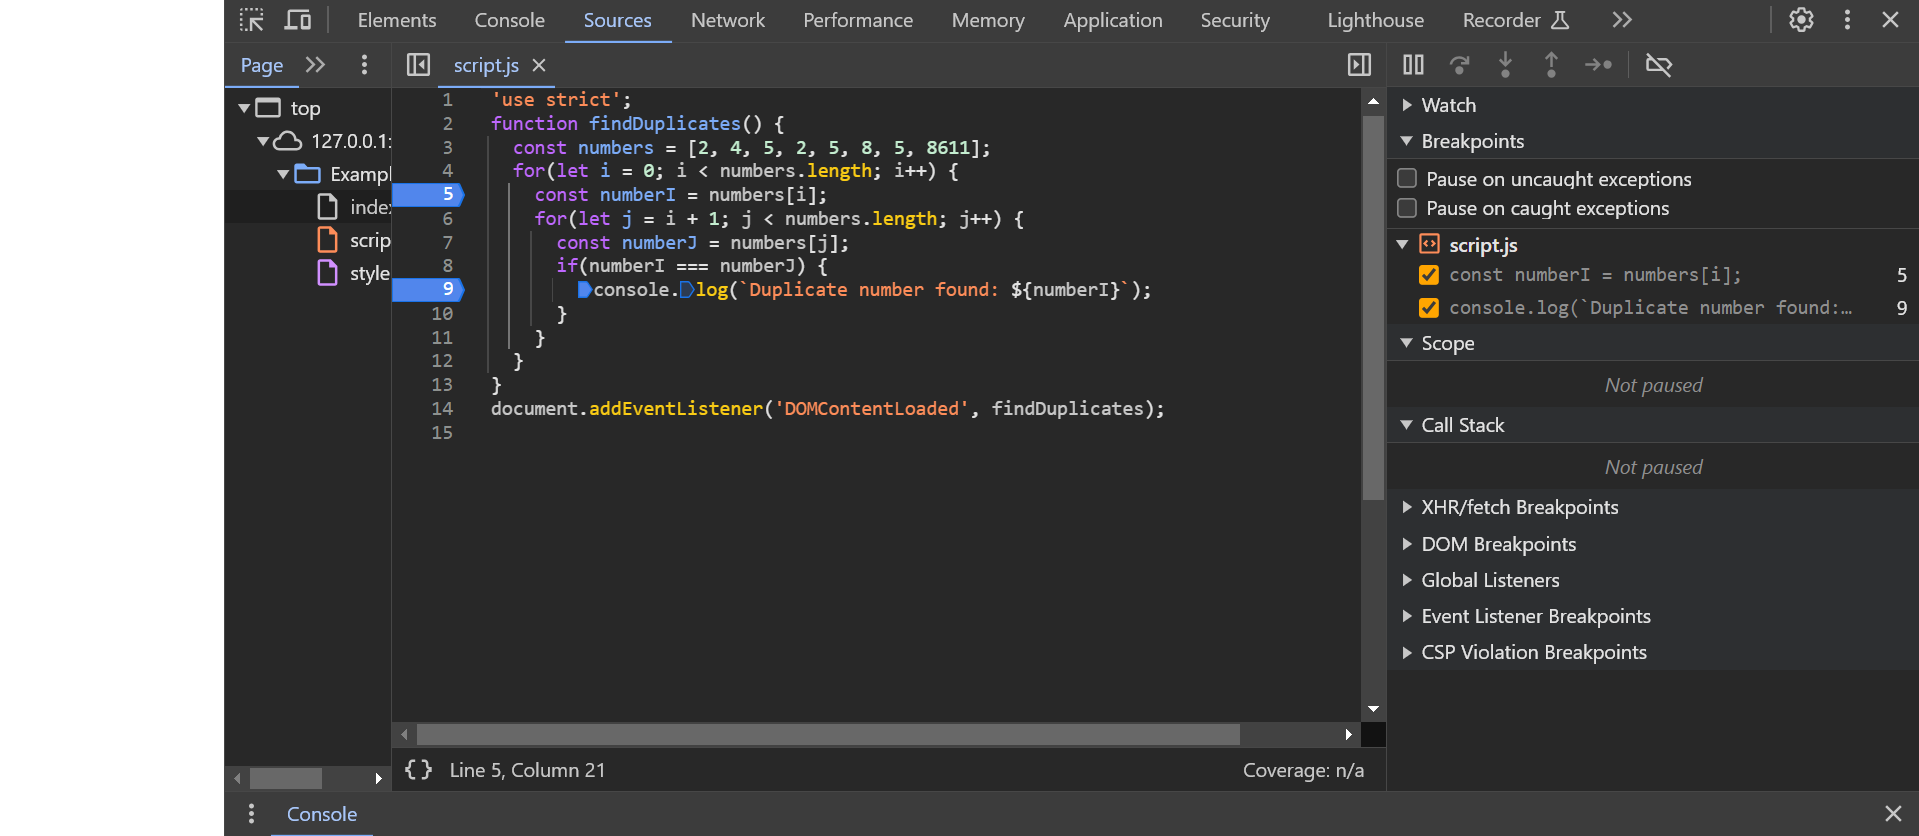
The breakpoints are not limited to a single source code file, but can be used anywhere within a program, even if the program consists of several source code files.
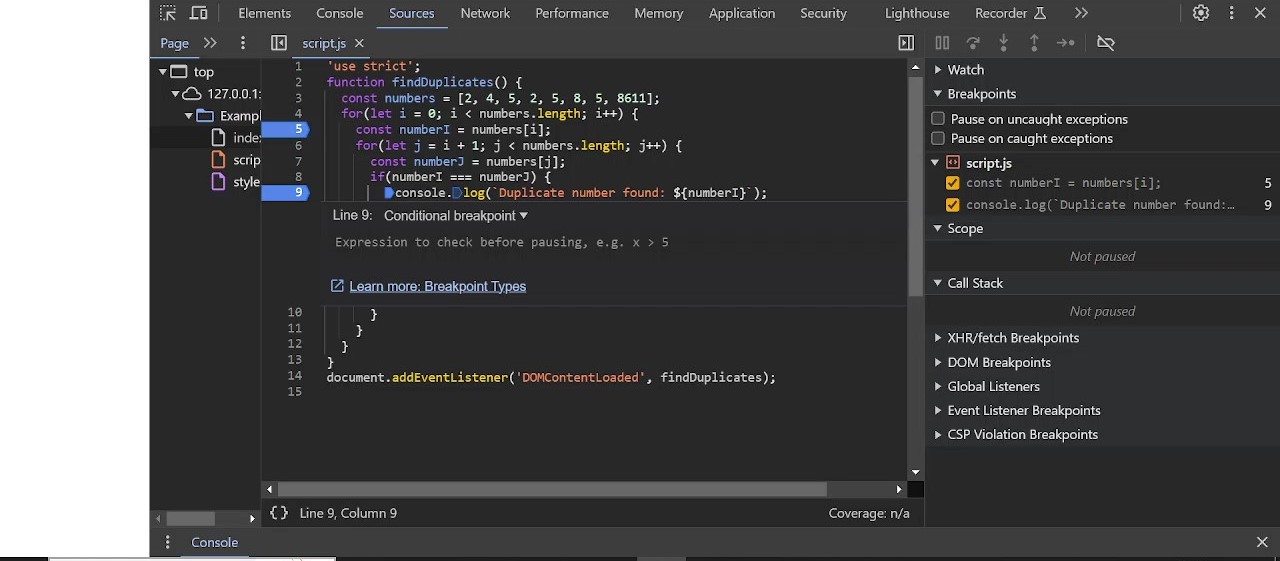
5. Define further breakpoints
- Conditional breakpoints allow execution to be stopped at the corresponding line of code only if the condition associated with the breakpoint is met.
- DOM breakpoints allow execution to be paused when the content of a web page has been dynamically changed.
- Event listener breakpoints allow execution to be stopped when a specific event is triggered within a web page.
- XHR breakpoints allow execution to be stopped when a so-called Ajax call is executed.
6. View the function call stack
In addition to the variable assignment, you can also display the function call stack.
Code example
Complete Code - Examples/Part_111/script.js...
 function compareNumbers(numberI, numberJ) {
   if(numberI === numberJ) {
     console.log(`Duplicate number found: ${numberI}`);
   }
 }
 function checkNumber(numberI, numbers, i) {
   for(let j = i + 1; j < numbers.length; j++) {
     const numberJ = numbers[j];
     compareNumbers(numberI, numberJ);
   }
 }
 function findDuplicates() {
   const numbers = [2, 4, 5, 2, 5, 8, 5, 8611];
   for(let i = 0; i < numbers.length; i++) {
     checkNumber(numbers[i], numbers, i);
   }
 }
 document.addEventListener('DOMContentLoaded', findDuplicates);
Here, the content of the outer loop is now in the checkNumber() function, which is called with the current number as the first argument and the entire array as the second argument. The content of the inner loop is also located in the compareNumbers() function. This means that the findDuplicates() function calls the checkNumber() function for each number in the array, which in turn calls the compareNumbers() function for each subsequent number.
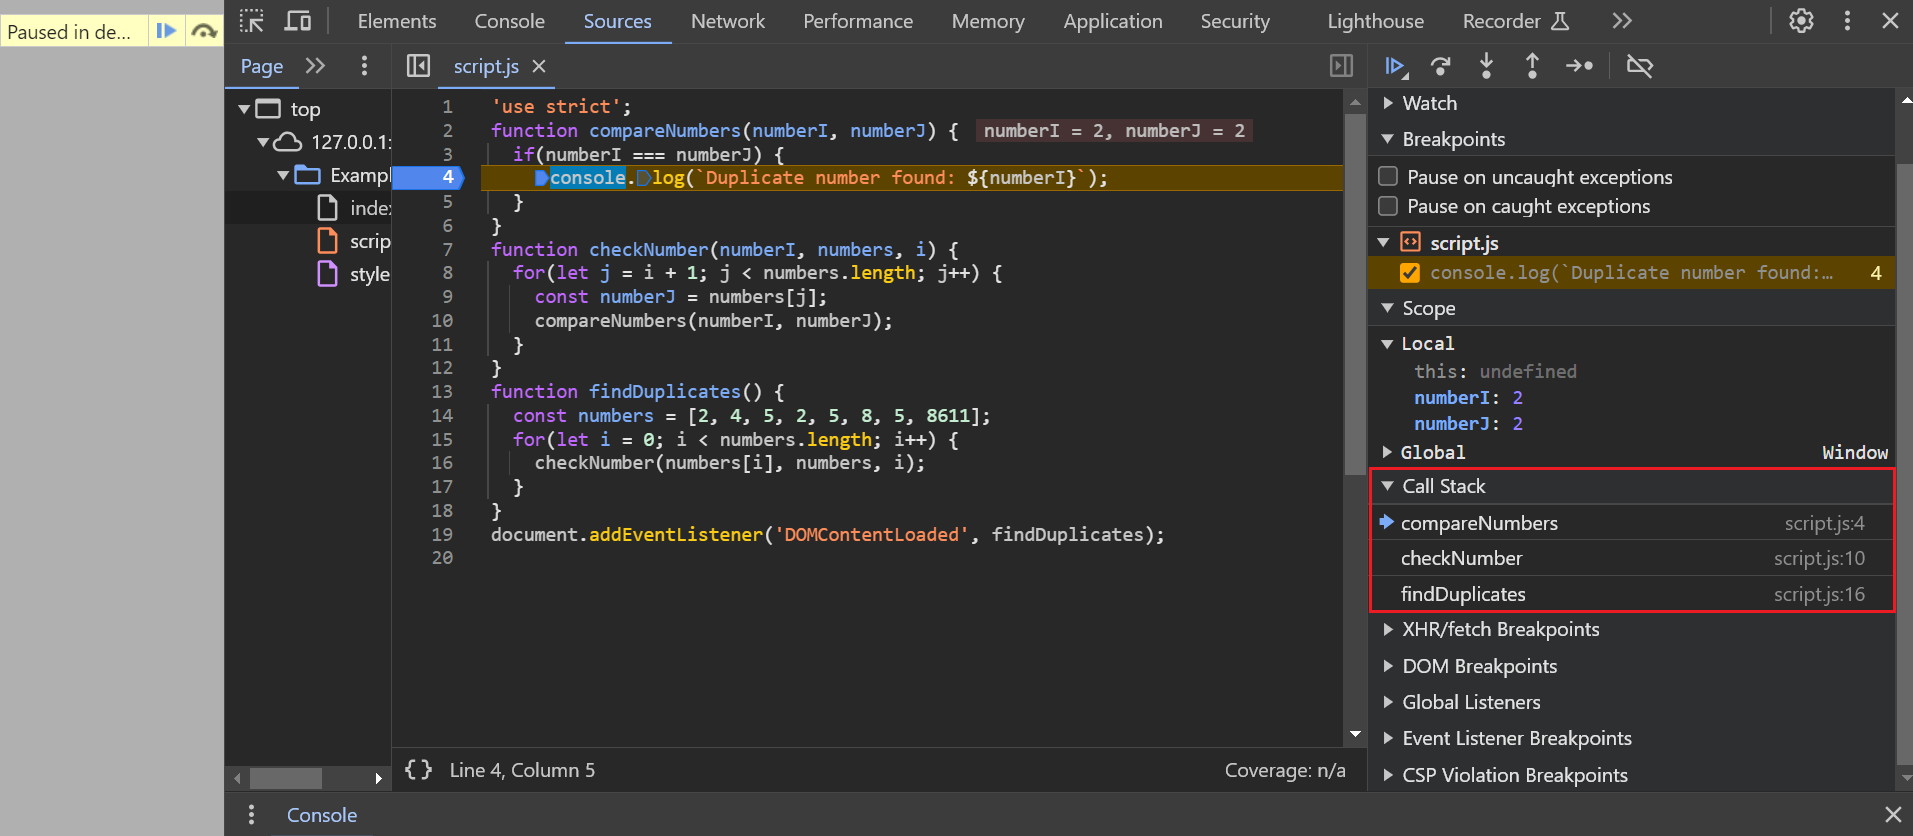
If you now set a breakpoint within the compareNumbers() function, you can easily view the function call stack. To do this, simply select the Call Stack tab on the right-hand side. The top function name that is displayed represents the current function, the functions below that from which the current function was called and so on.